

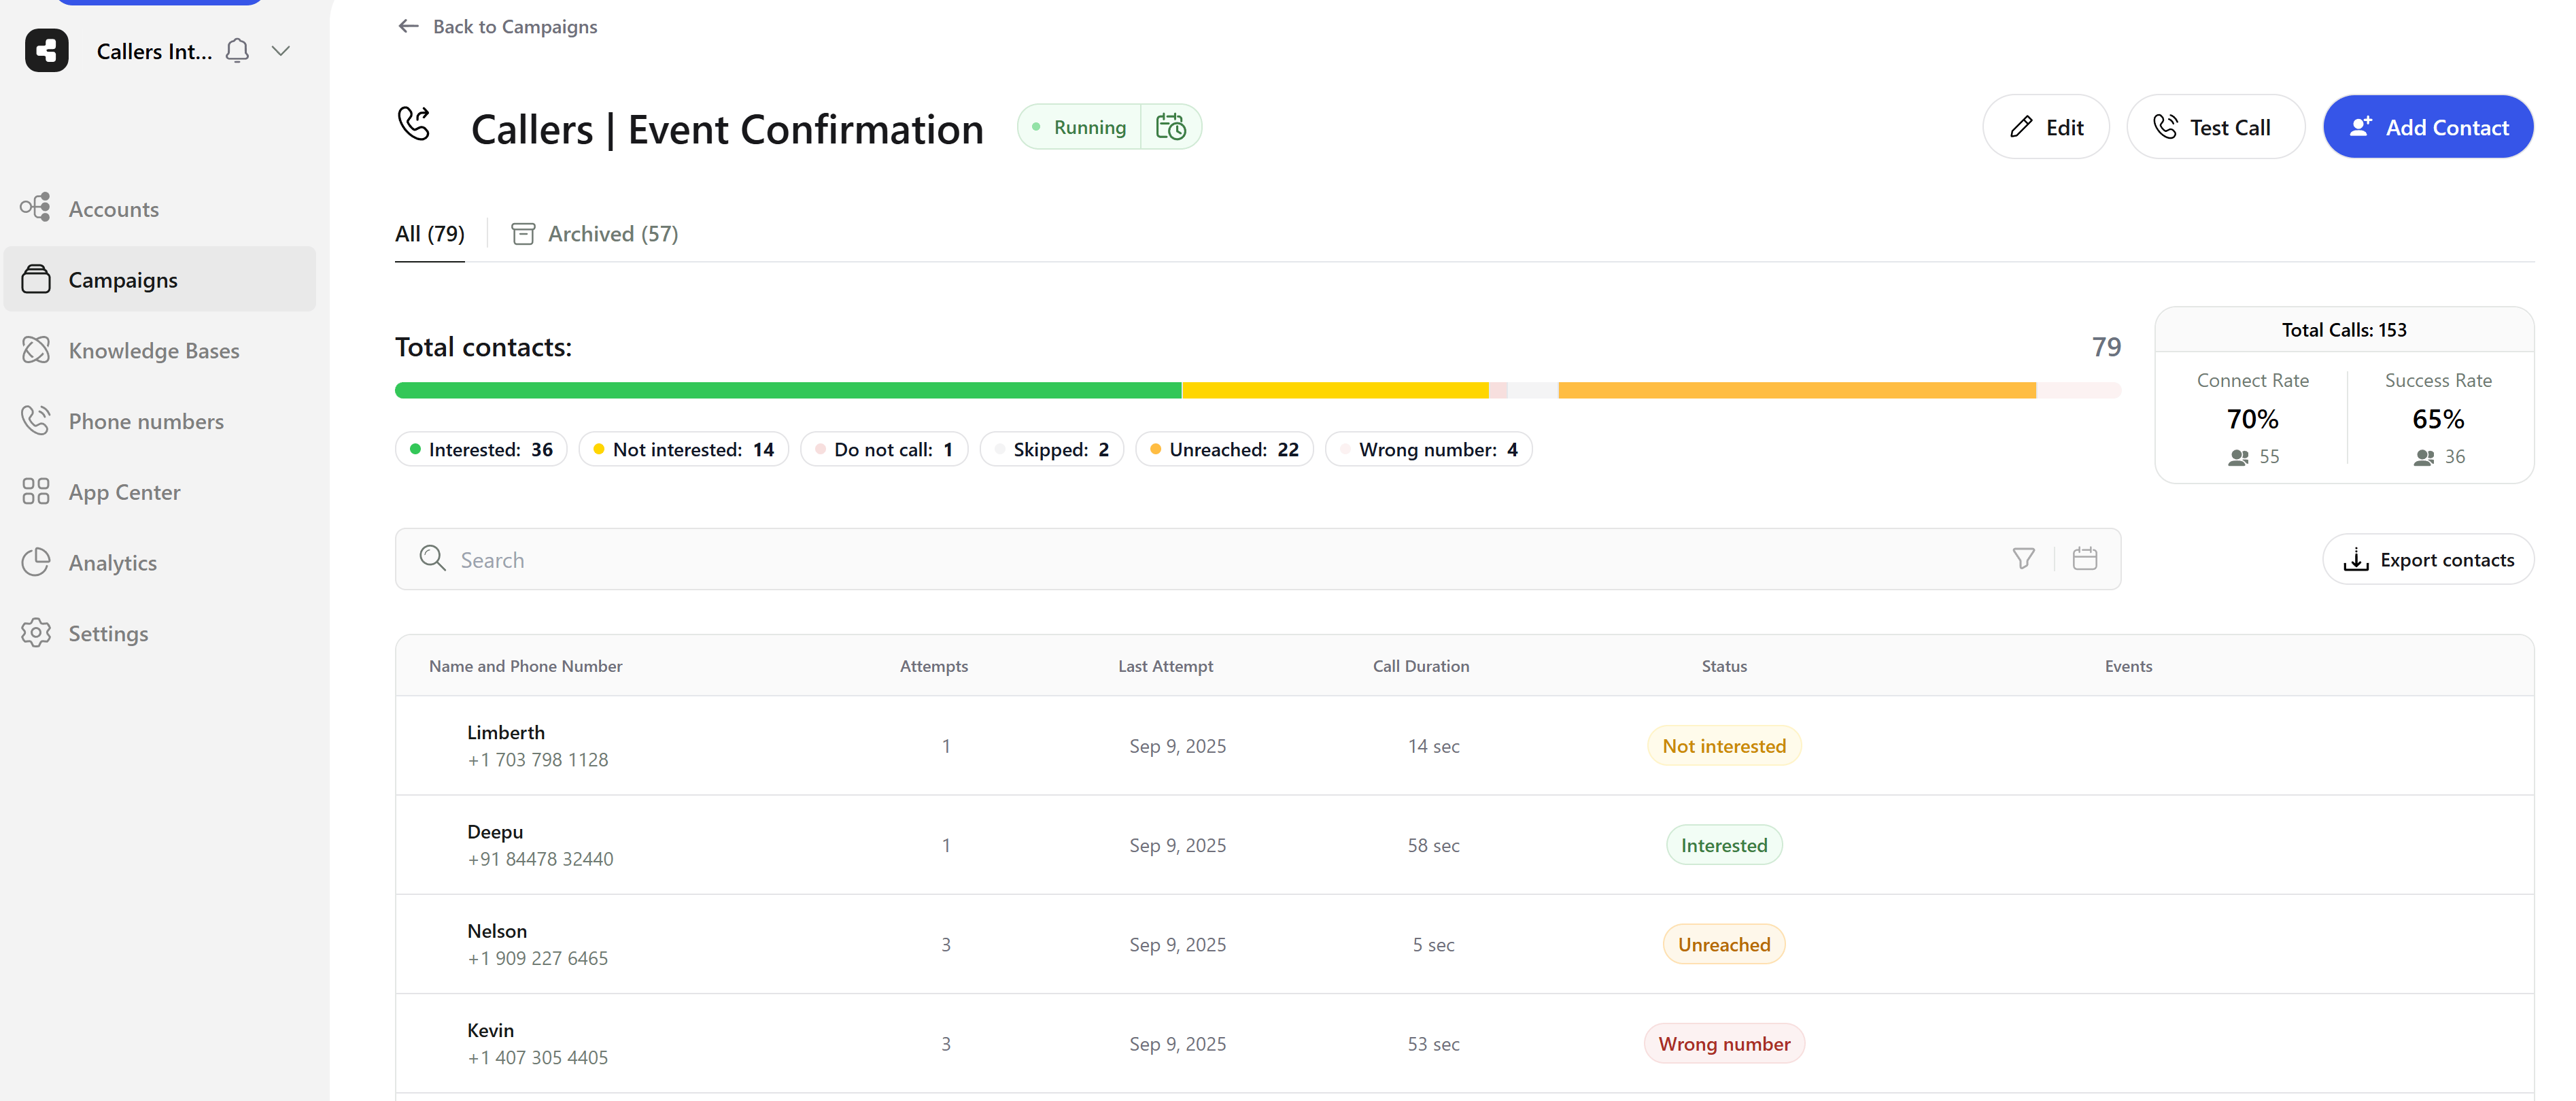
Agent dashboard example
Agent Screen
*When opening your agent here is what you will find:- Agent Status: At the top, you can see the name of the agent and a colored area indicating the agent’s current status (e.g., green for active, orange for stopped).
- Contact Summary: A bar graph displays the total number of contacts broken down by status: Interested, Not interested, Unreached, Failed, Do not call, Wrong number, and Call me later. This provides a quick snapshot of your agent’s engagement levels.
- Contact List: Below the summary, there is a detailed list of contacts including their name, phone number, the number of call attempts, the date of the last attempt, call duration, and the status of the last call (e.g., Interested, Not Interested, Wrong Number).
- Agent Statistics:
- Total Contacts: The total number of contacts in the agent.
- Total Calls: The total number of calls made during the agent.
- Connect Rate: The percentage of calls that successfully connected with a contact.
- Interest Rate: The percentage of contacts who showed interest out of those who answered the calls.
- Functionality Buttons: At the top right, you have buttons for various actions such as editing the agent, testing calls, and adding new contacts.
- Navigation Panel: On the left side, there’s a navigation panel that allows you to quickly access different parts of the Callers platform such as new agent creation, agent overview, integrations, API keys, and phone number management.
- User Information: At the bottom left, you can see your user role and a unique identifier for your user account.
Insights Mode:
- Gain actionable insights with a clear, step-by-step breakdown of how callers interact with your agent script. Key performance metrics make it easy to spot drop-off points and identify where hang-ups occur.
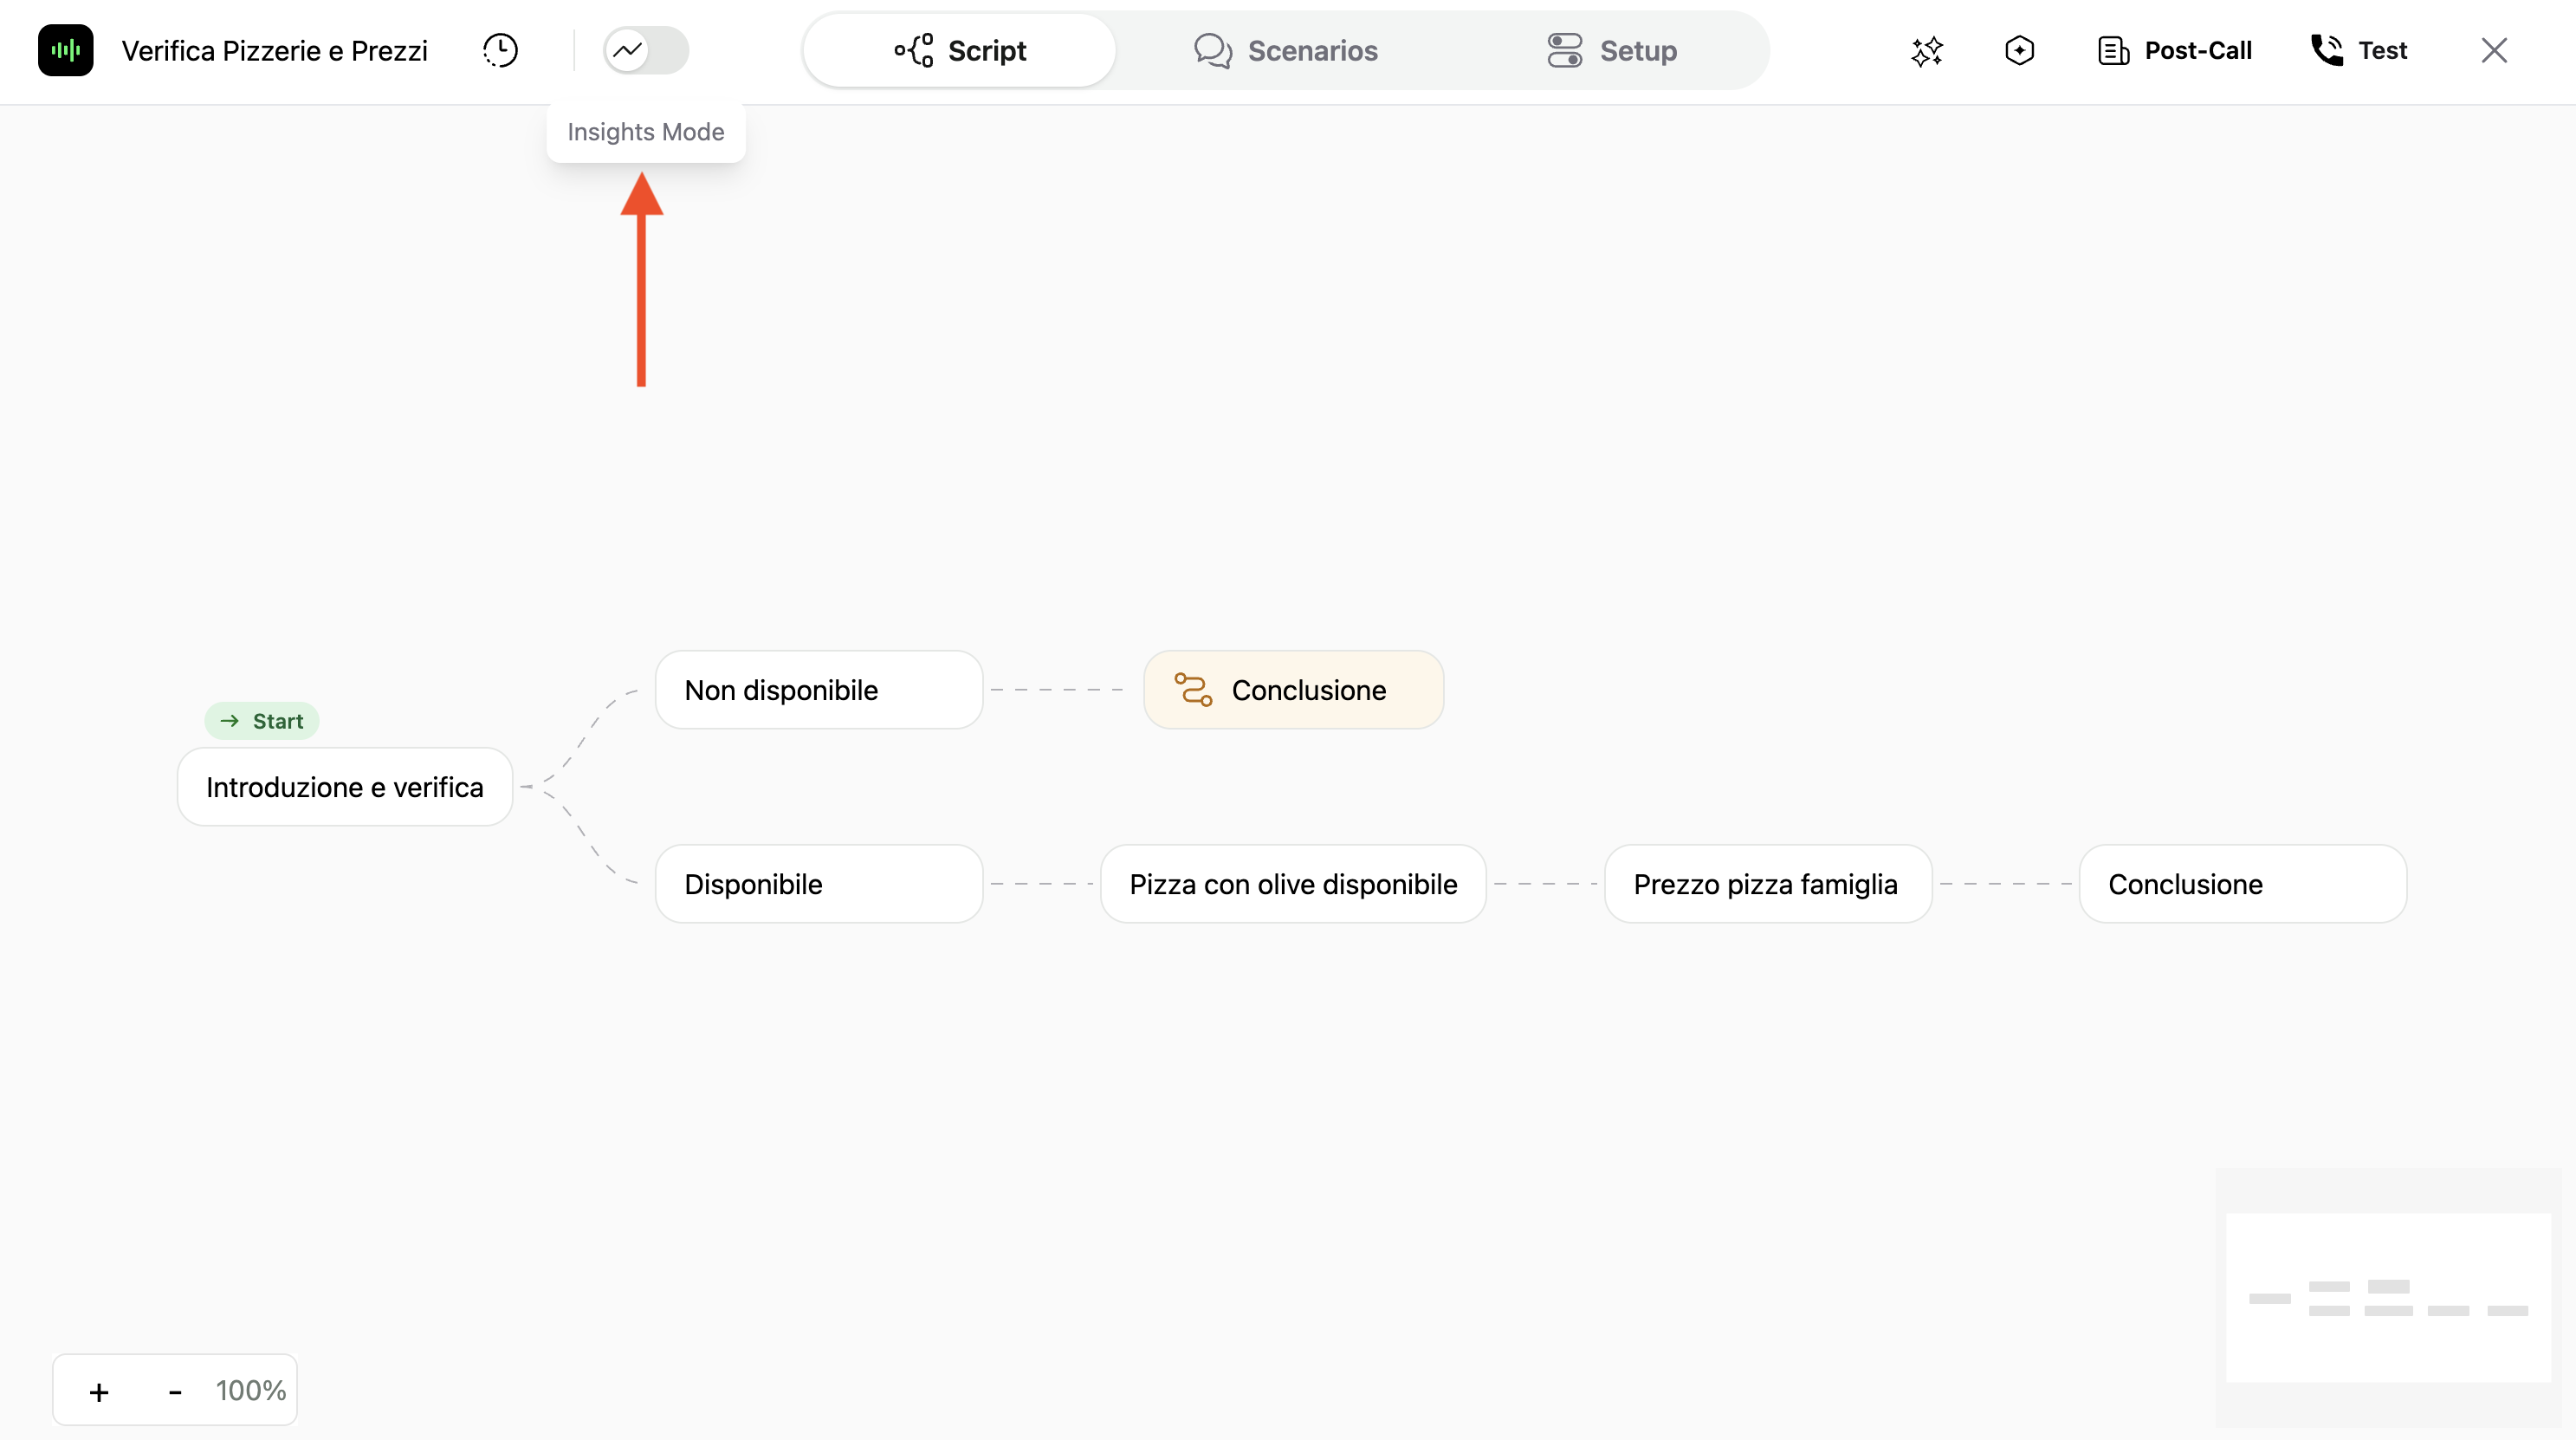
Agent Insights Button
- Access insight Mode by clicking the
insights buttonat the top left of the agent Edit screen.
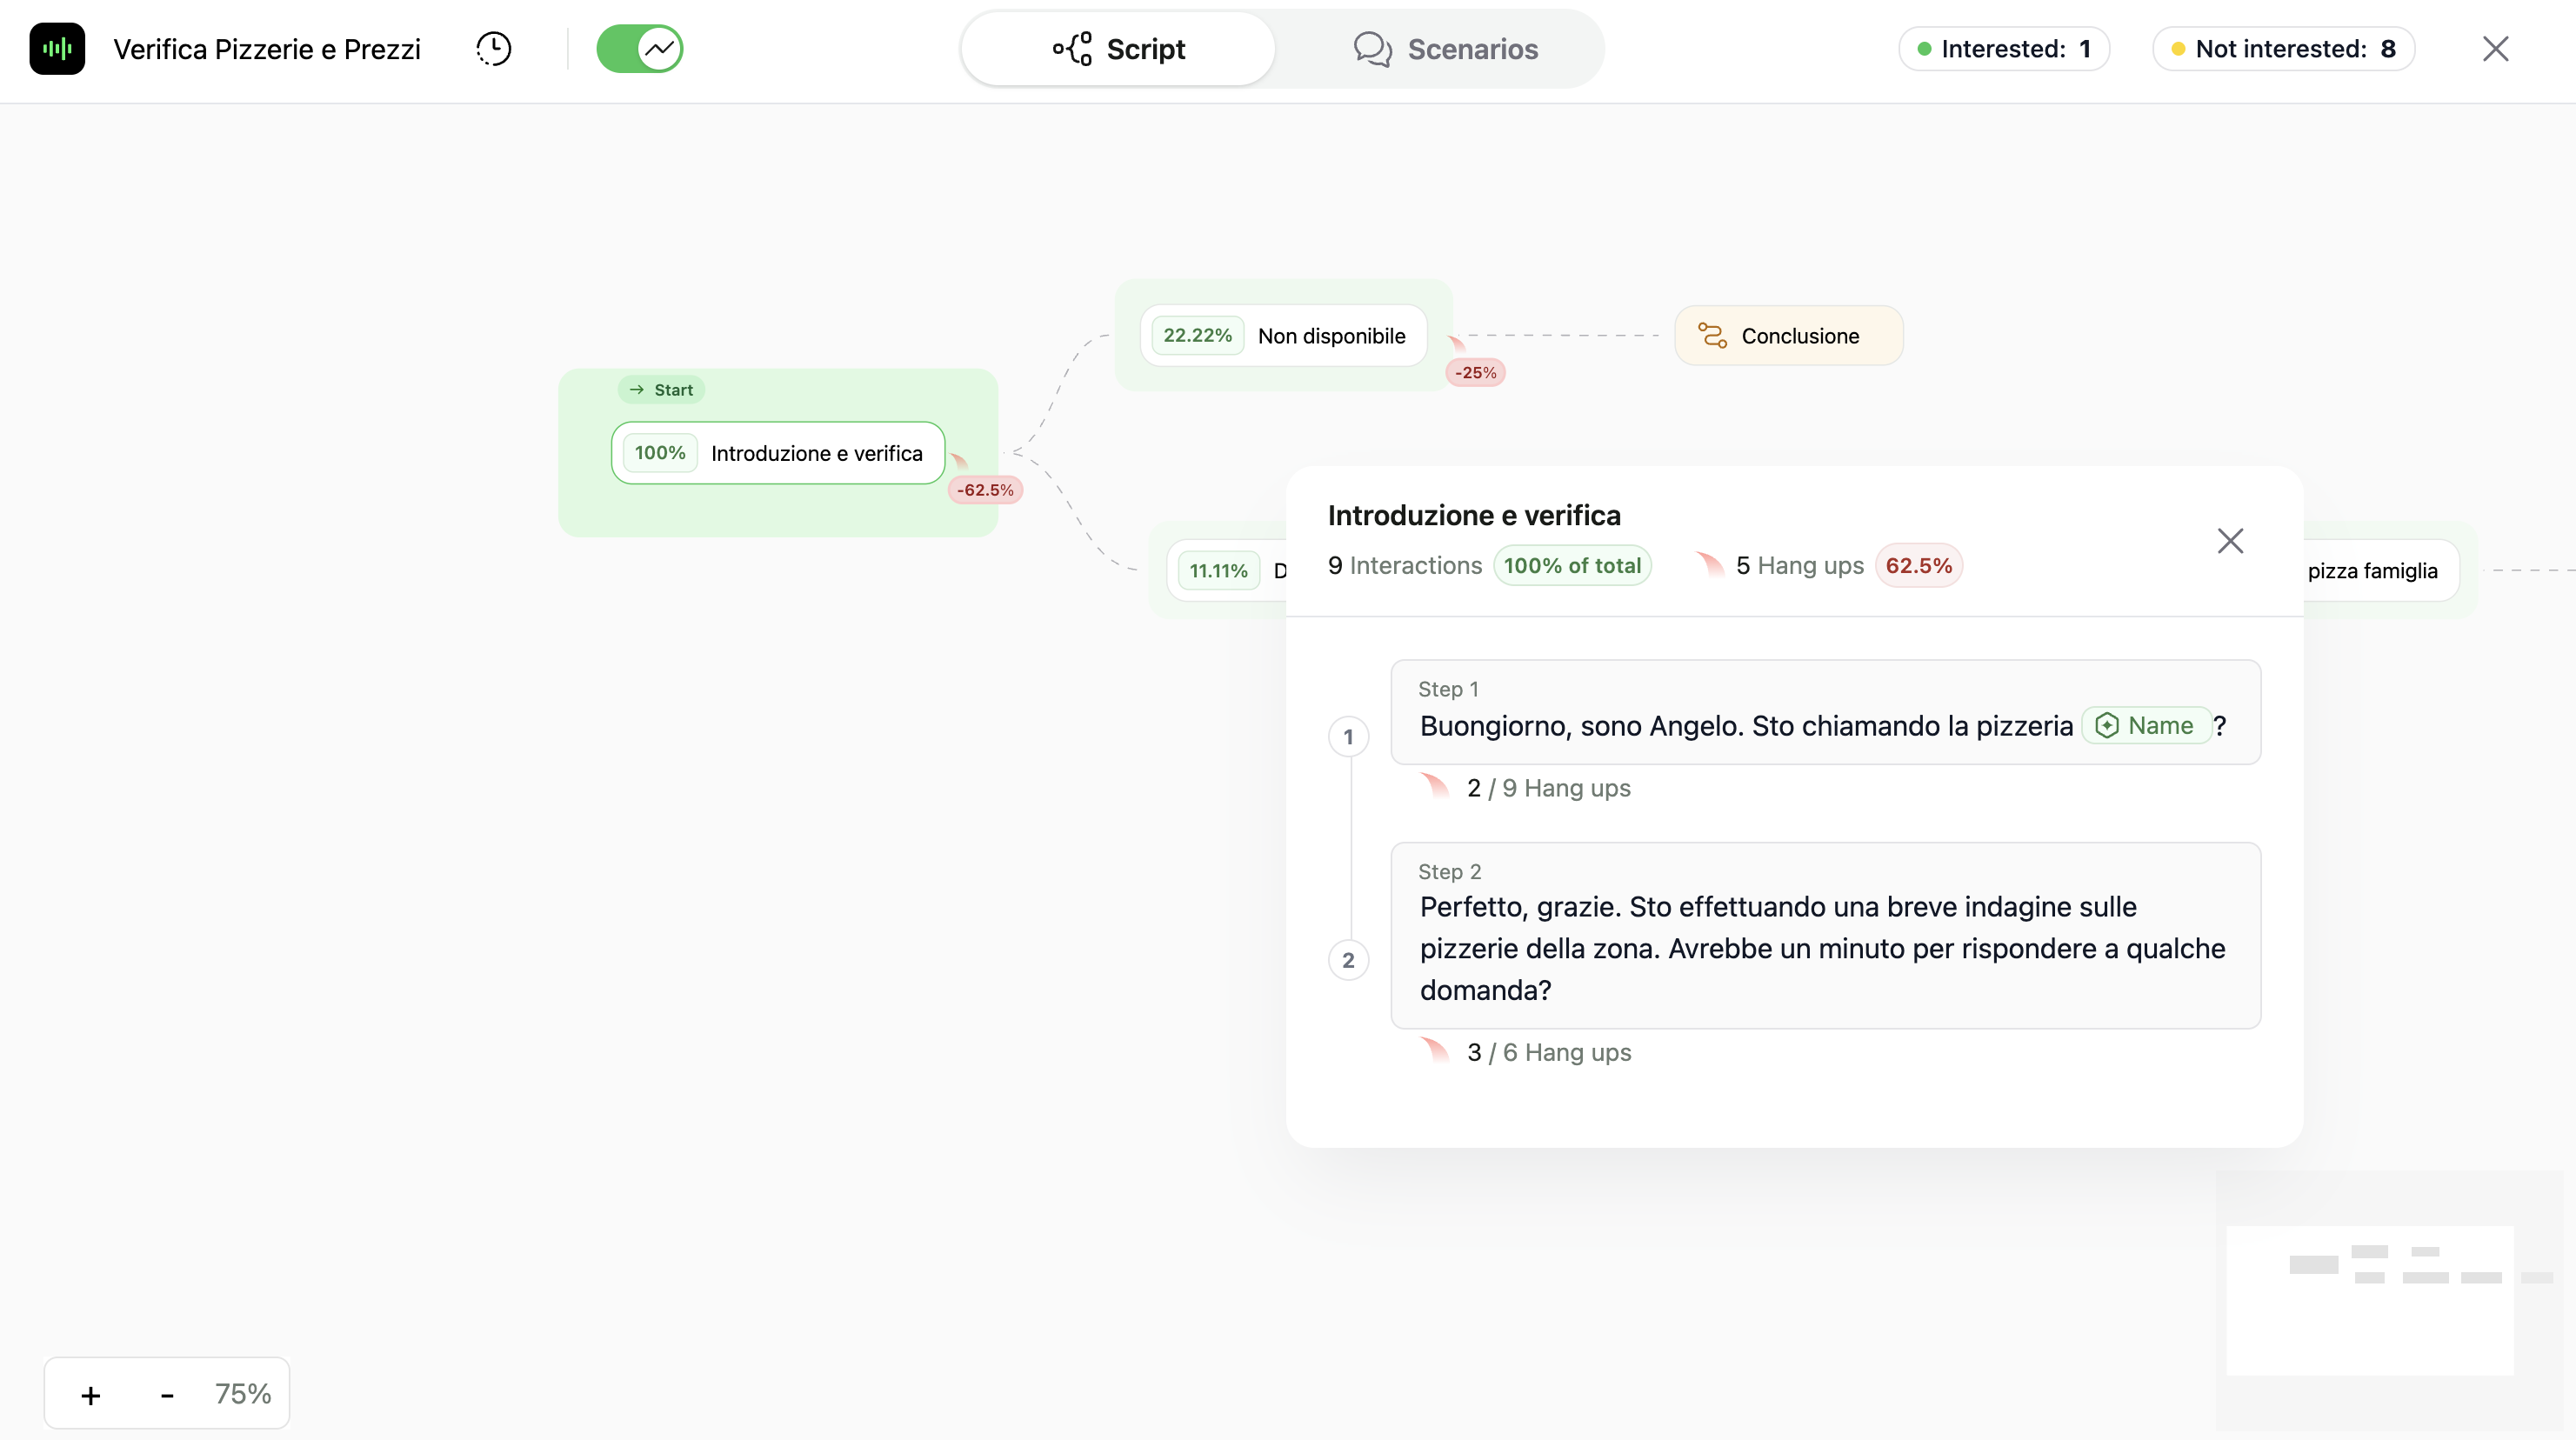
Agent Insights Mode
- When on Insights Mode you will be shown the following metrics:
- Interaction percentage: represented with a green outline on each step, denoting the amount of callers that reached the specific subflow.
- Hang up percentage: displayed in red to the right of each subflow, and under each step within subflows.
- Total calls summary: At the top right you will see total amount of intersted and not interested callers.
Metrics are displayed only for the current version of the agent script. If any changes are made to the script, all performance data will reset.