Overview
- The Analytics module is powered by an enterprise-grade BI tool fully integrated into the Callers platform. This powerful addition gives users access to real-time statistics, performance metrics, and actionable insights; all from a single interface. Whether you’re tracking campaign effectiveness, monitoring usage patterns, or identifying trends, the analytics dashboard makes it easy to visualize and interpret your data. The result: faster, smarter decision-making for your team.
Key Capabilities
- Real-Time Dashboards: Monitor key metrics across live and historical campaigns with visual dashboards that auto-refresh with new data.
- Filter & Segment: Filter data across date ranges, campaigns, users, or call outcomes to refine your reports.
- Export Reports: Download charts and datasets in multiple formats for sharing or deeper analysis.
- Drill-Down Capabilities: Click into visualizations to explore detailed breakdowns by agent, time, or customer segments.
Use Cases
- Campaign Optimization: Identify which scripts or steps yield the best engagement or conversion rates.
- Operational Monitoring: Track assistant usage, call volume, average duration, and abandonment rates.
- Trend Analysis: Spot patterns in user behavior or call outcomes over time.
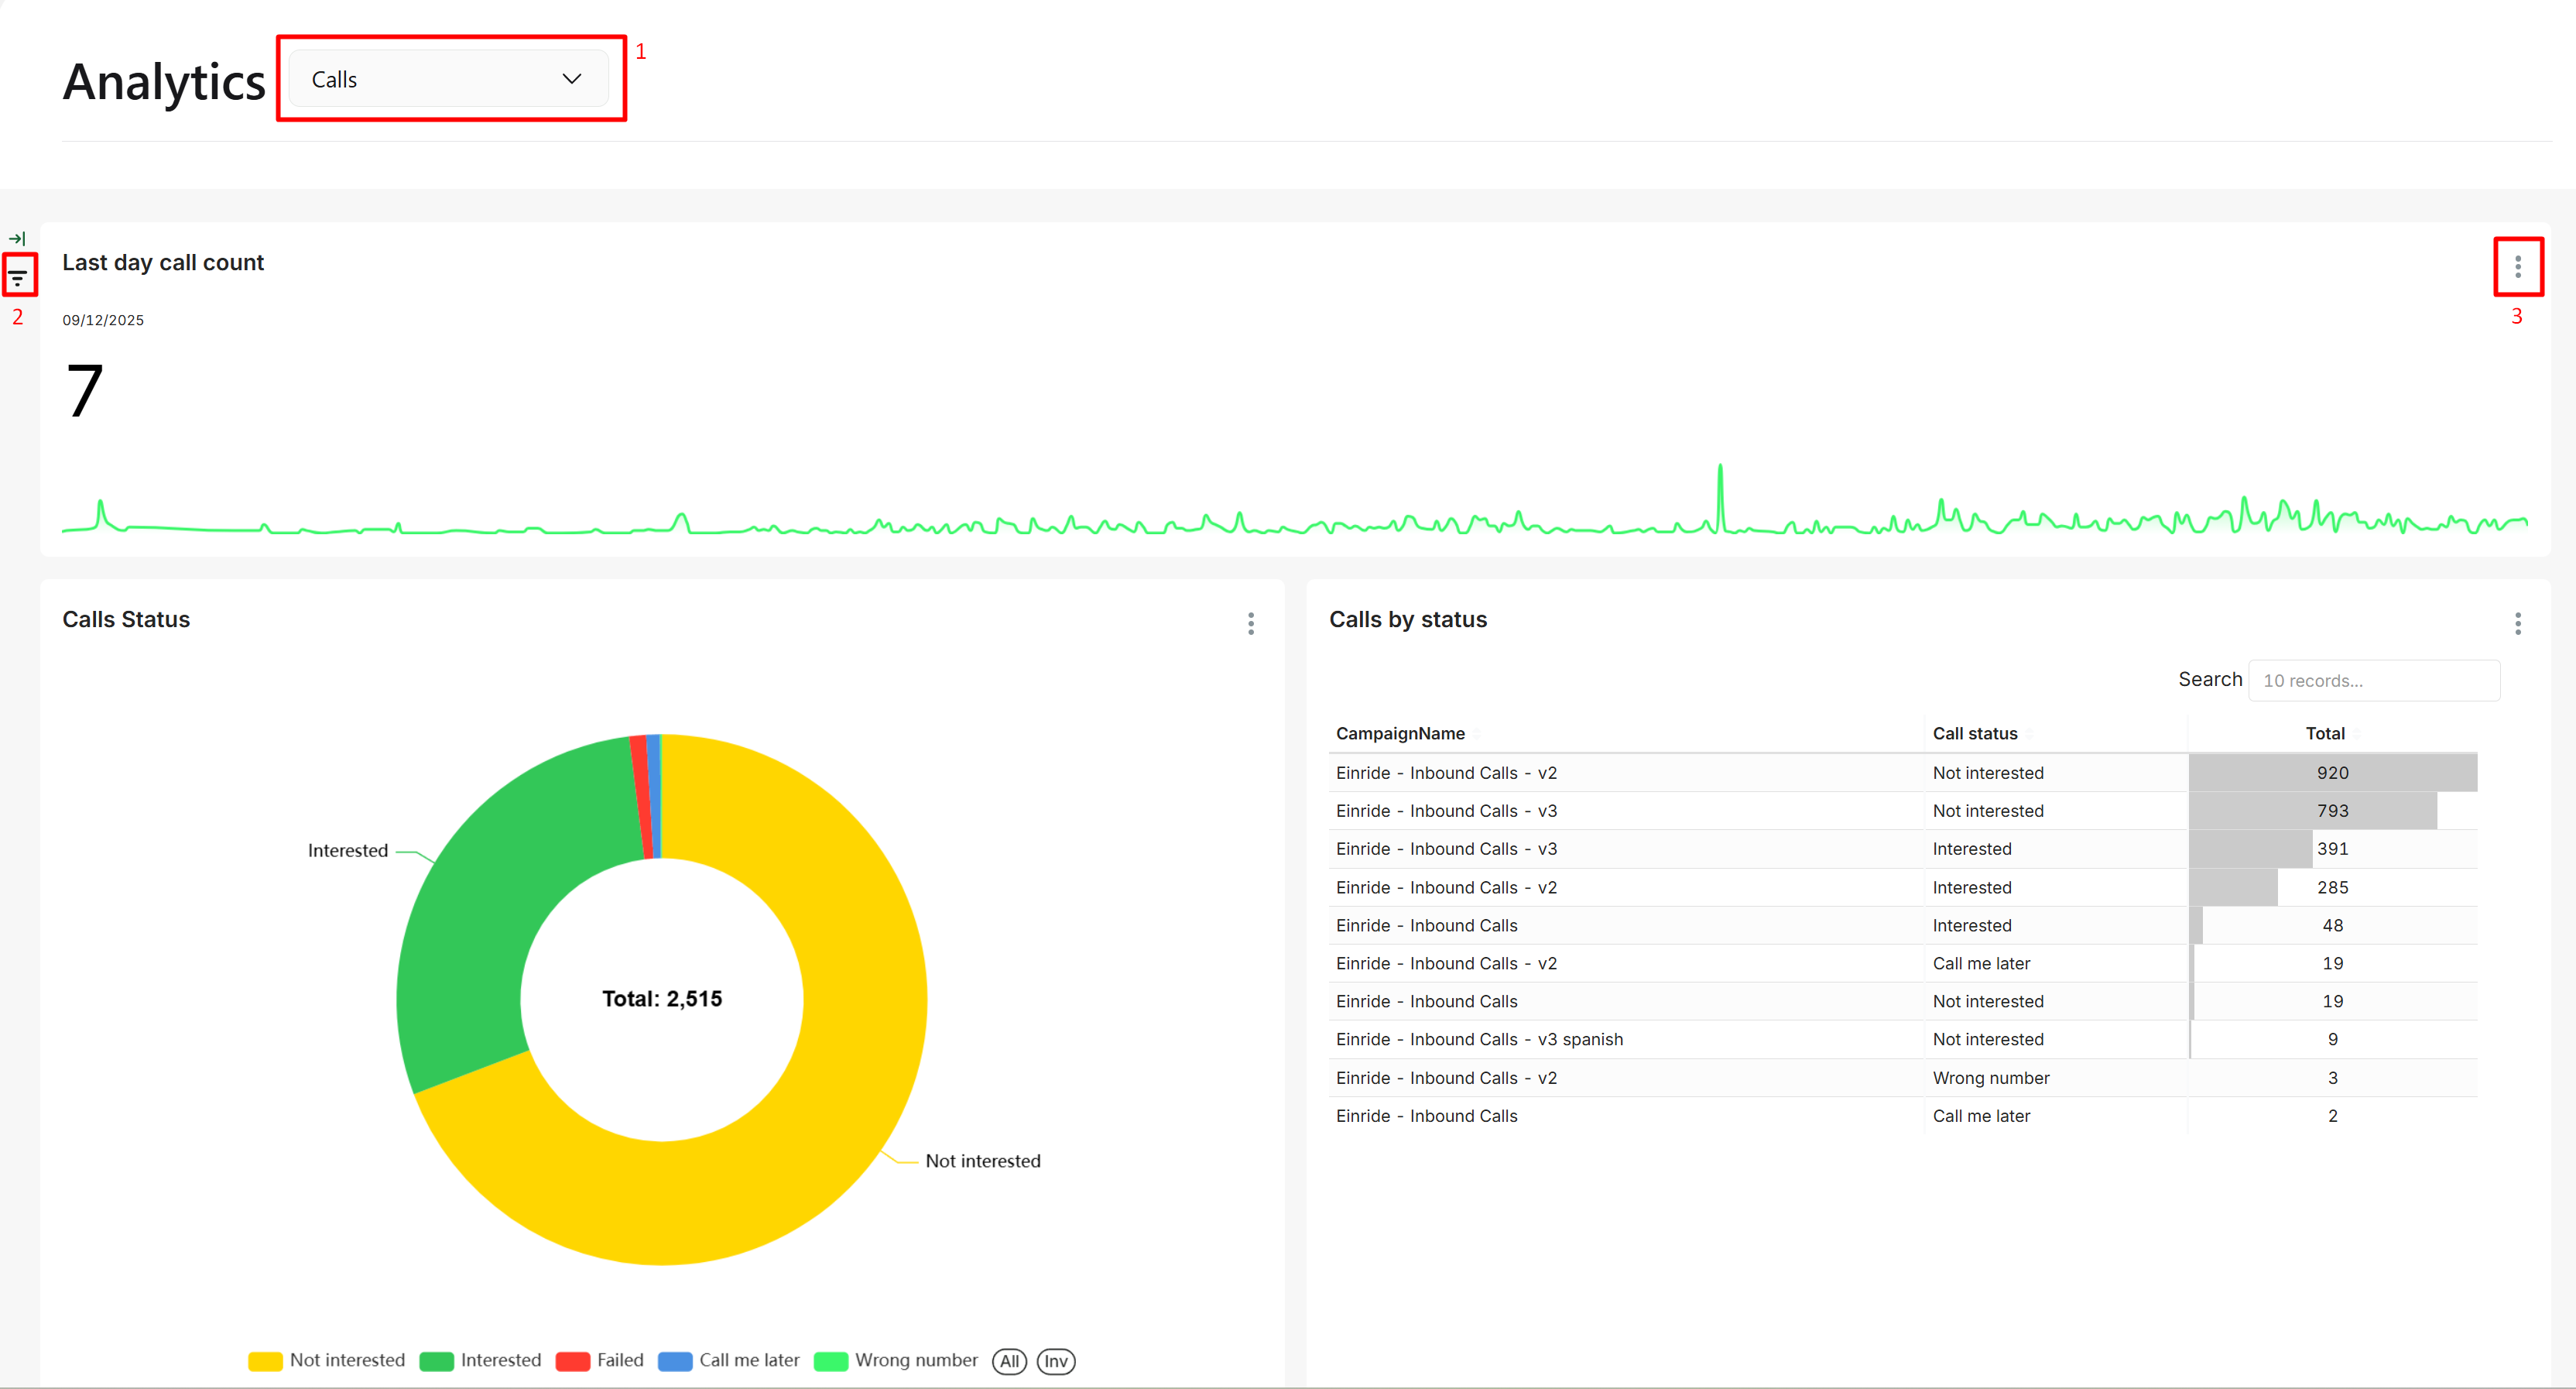
Getting Started
- Use the dropdown at the top to select a prebuilt dashboard view.
- Use the filter icons on each chart to adjust the data by time range, campaign, or other dimensions.
- Click the menu icon
⋮to download charts as CSV, Excel, or image files for further analysis or reporting.
Need a specific report that’s not available out-of-the-box? Reach out to our support team to discuss custom dashboard solutions.